
Shopify Product Page Design: The 2026 Framework That Turns Browsers Into Buyers
Your Shopify product page design determines whether visitors buy or bounce. Not your brand story, not your Instagram following, not your homepage hero image. The product page is where purchasing decisions happen, and most stores get it catastrophically wrong.
After redesigning product pages for 50+ DTC brands across supplements, skincare, and sustainable products, I can tell you the pattern repeats itself: stores invest thousands in driving traffic, then lose 98% of those visitors on product pages that fail at their only job convincing someone to click add to cart.
The numbers tell the story. According to Baymard Institute’s 2025 usability research analyzing 11,000 e-commerce sessions, the average product page converts at 2.1%. Top performers hit 6-8%. That gap isn’t about having better products or bigger budgets. It’s about understanding what actually drives purchase decisions and structuring your Shopify product page design around those drivers.
This framework breaks down the specific design elements that consistently move conversion rates from mediocre to exceptional, based on product pages where we’ve documented the before and after metrics.
Why Generic Shopify Product Page Design Fails

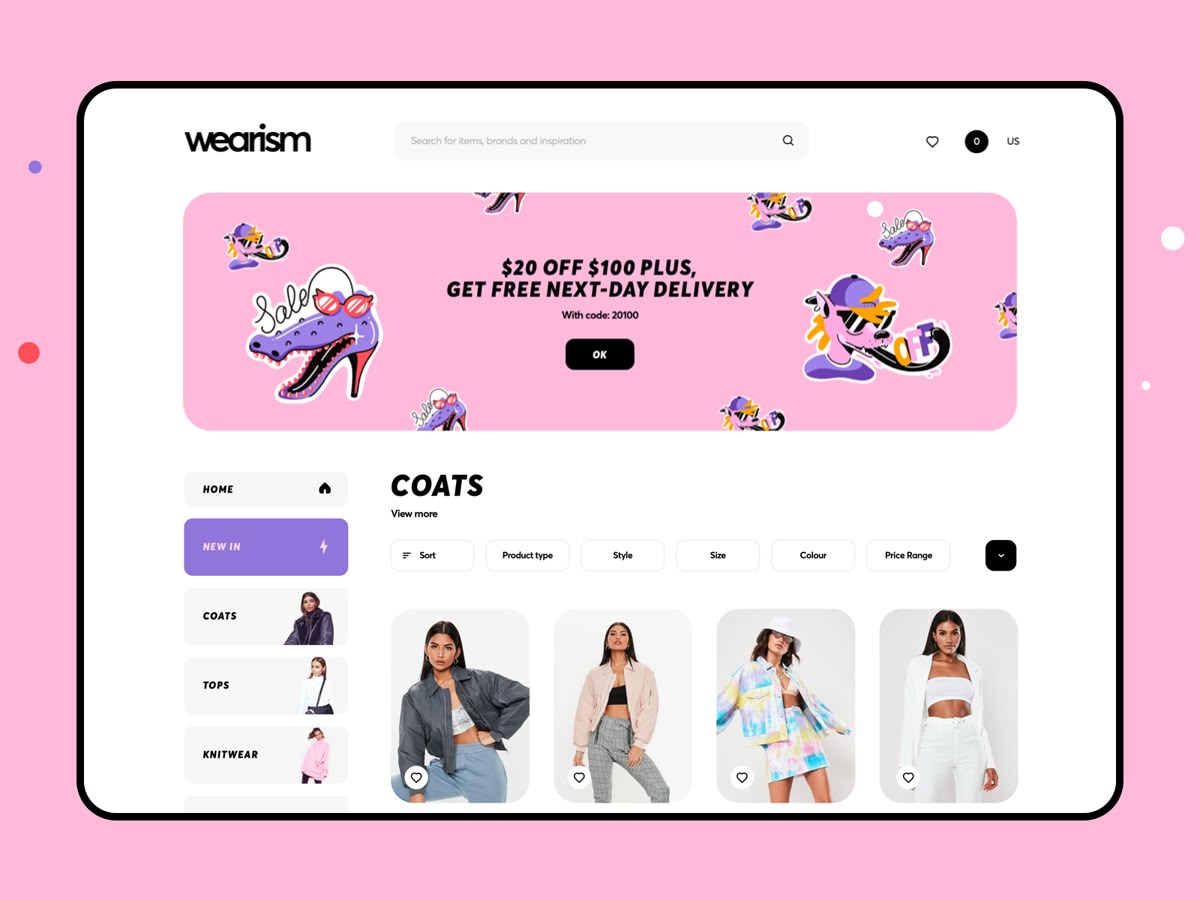
The default approach to product page design follows a predictable template. Product images on the left, product title and price on the right, description below, reviews at the bottom. Add to cart button somewhere in the middle. This structure exists because it’s easy to implement, not because it converts well.
The fundamental problem is that template-based product page design treats all products the same way. A $28 face serum and a $180 supplement bundle get identical layouts. A first-time visitor and a returning customer see the same page. Someone coming from Instagram and someone coming from a Google search for “best magnesium for sleep” land on identical experiences.
High-converting Shopify product page design starts with a different question: what does this specific visitor need to see, in what order, to confidently make a purchase decision?
For a supplement brand I worked with last year, their existing product pages followed the standard template. Conversion rate sat at 1.4%. The pages looked fine. Professional product photography, clean layout, standard Shopify theme everyone uses. But they weren’t optimized for how people actually evaluate supplements before buying.
We rebuilt the pages around supplement-specific trust signals and decision drivers. Clinical study results moved above the fold. Third-party testing certificates appeared next to ingredient lists. Before/after testimonials with specific health outcomes replaced generic five-star ratings. Customer photos showing the actual product bottles they received sat next to product images.
Product page conversion jumped to 3.9%. Same traffic, same products, same pricing. The only variable that changed was how the page was designed to address the specific questions someone has when evaluating whether a supplement is worth buying.
The Psychology Behind Product Page Decisions

Understanding what drives someone to click add to cart requires looking past surface-level metrics into the actual psychology of online purchasing decisions.
Research from the Baymard Institute shows that 63% of shoppers compare multiple products before buying. They’re not just evaluating whether they want your magnesium supplement. They’re evaluating whether they want your magnesium supplement more than the seven other options they’ve looked at this week.
Your Shopify product page design needs to answer a specific hierarchy of questions, in order, or visitors drop off.
Question one: Is this actually what I’m looking for? This needs to be answered within three seconds of landing on the page. If someone came from an ad promising “clinical-strength retinol for sensitive skin” and lands on a page showing generic “anti-aging serum,” that’s a disconnect. The headline, hero image, and opening copy need to immediately confirm they’re in the right place.
Question two: Why should I believe this will work? Generic product descriptions don’t answer this. “High-quality ingredients” and “dermatologist-tested” are claims every brand makes. Specific evidence moves the needle. “Reduced fine lines by 34% in clinical trials with 287 participants” gives someone concrete information to evaluate. Customer testimonials that include specific outcomes matter more than star ratings.
Question three: Why should I buy from you instead of your competitors? This is where most Shopify product page design completely fails. Stores assume their product is self-evidently better. It’s not. You need to explicitly communicate your differentiation, whether that’s ingredient sourcing, third-party testing, manufacturing process, or money-back guarantees.
Question four: What’s the catch? Every buyer has this question, even if they don’t articulate it. If your price is higher than competitors, why? If it seems too cheap, is quality compromised? If results seem too good, are you exaggerating? Your product page needs to preemptively address these concerns.
Question five: What happens if I’m not satisfied? Return policy, shipping times, customer service accessibility. These seem like minor details but they’re often the final friction point before purchase.
The stores that convert at 5-6% structure their Shopify product page design to answer these questions in sequence, using specific design elements placed strategically throughout the page.
The Essential Elements of High-Converting Product Page Design
Through systematic analysis of product pages that consistently outperform benchmarks, certain structural elements appear repeatedly. These aren’t decorative choices. They’re functional components that address specific stages of the purchase decision process.
Visual Hierarchy That Guides the Eye
Most product pages treat every element as equally important. The result is visual chaos where nothing stands out. High-converting pages use deliberate hierarchy to guide visitors through information in the optimal sequence.
The hero section occupies the most valuable real estate on your page—everything visible without scrolling. This space needs to accomplish three things simultaneously: confirm the visitor is in the right place, communicate the core value proposition, and present the product visually.
For a skincare brand we worked with, their existing hero section showed a single product photo on the left and product name on the right. Conversion rate was 1.8%. We restructured the hero to lead with an outcome-focused headline (“Fade Dark Spots in 30 Days Without Irritation”), supported by a before/after comparison image, with the product shown in context of use.
The product title moved to a smaller, secondary position. The transformation result became the hero. Conversion rate increased to 3.4%.
The principle applies throughout the page. What visitors need to see first gets prominent placement, larger sizing, higher contrast. Supporting information appears in a logical flow downward. The add-to-cart button doesn’t compete with seventeen other elements for attention—it stands out through strategic use of color, size, and white space.
Product Imagery That Builds Confidence
Standard product page design includes 3-5 product photos: front view, side view, back view, maybe a detail shot. This works fine if you’re selling t-shirts. It fails completely for products where visual appearance alone doesn’t communicate value.
The skincare brand mentioned earlier used professional studio shots of their serum bottle. Clean, attractive images. But they didn’t help someone understand what the product would do for their skin. Adding lifestyle images showing application, texture shots demonstrating consistency, and before/after images of actual customer results increased conversion by 47%.
For supplement brands, the challenge is even greater. A bottle of magnesium capsules photographed from four angles doesn’t tell you anything useful. We photograph supplements in context—on a nightstand next to a book and reading glasses for sleep products, on a kitchen counter next to breakfast for morning vitamins, in a gym bag for pre-workout formulas.
Including images of the supplement facts label, certificates of analysis, and third-party testing results gives visitors the technical information they’re looking for without requiring them to scroll through text descriptions to find it.
Video integration amplifies this further. A 30-second video showing product application, demonstrating texture, or explaining usage increases time on page and correlates with higher conversion. According to Wyzowl’s 2025 video marketing report, 84% of people say they’ve been convinced to buy a product after watching a brand’s video.
The critical principle is that imagery needs to serve a functional purpose beyond aesthetic appeal. Every image should answer a question or address a concern that affects the purchase decision.
Copy That Sells Outcomes, Not Features
The most common failure in Shopify product page design is copy that describes what the product is rather than what it does for the customer. This pattern appears in roughly 80% of the stores we audit.
A supplement brand’s product description might list “450mg Magnesium Glycinate, Vitamin B6, L-Theanine.” Accurate, but useless for decision-making. Someone shopping for magnesium doesn’t care about the dosage until they first understand whether this product will help them sleep better.
The conversion-optimized version leads with the outcome: “Fall asleep 40% faster and wake up fewer times during the night.” The subheadline explains the mechanism: “Our magnesium glycinate formula reduces cortisol and supports healthy sleep-wake cycles.” The body copy provides evidence through clinical studies and customer results. The specific ingredients and dosages appear in an expandable section for those who want technical details.
This isn’t about dumbing down information. It’s about sequencing it in the order that matches how people actually make purchasing decisions. Lead with what matters most—the problem this solves and the outcome it delivers. Support with how it works. Provide technical specifications for those who want to dig deeper.
Benefit-driven copy also needs to be specific rather than generic. “Better sleep” is vague. “Fall asleep in 20 minutes instead of an hour” gives someone a concrete expectation to evaluate. “Healthier skin” means nothing. “Reduce redness by 40% in 14 days” provides measurable criteria.
We tested this directly with a sustainable cleaning products brand. Their existing product descriptions focused on eco-friendly credentials and ingredient sourcing. Conversion rate was 2.1%. We rewrote pages to lead with cleaning efficacy—”Removes wine stains, grease, and soap scum without harsh chemicals”—then supported with sustainability information below. Conversion jumped to 3.8%.
The environmental credentials still mattered to their audience, but they weren’t the primary purchase driver. People needed to know the products actually worked before caring about how eco-friendly they were.
Trust Signals Placed at Decision Points

Generic trust badges scattered across a product page do almost nothing for conversion. Strategic trust signals placed at specific friction points have measurable impact.
The challenge is identifying which trust signals matter for your specific product category and where they need to appear.
For supplements, third-party testing results and medical endorsements carry enormous weight. A “GMP Certified” badge in the footer is invisible. The same badge next to the add-to-cart button, with a hover state explaining what GMP certification means, addresses the safety concern exactly when someone is deciding whether to purchase.
For skincare, before/after photos and ingredient transparency matter most. We placed a “Full Ingredient Breakdown” expandable section directly below the product description on a beauty brand’s pages, with each ingredient linking to an explanation of its purpose and sourcing. The addition increased conversion by 22%.
For sustainable products, certifications and supply chain visibility build credibility. A furniture brand we worked with added a “Product Journey” section showing the sourcing location, manufacturing process, and carbon offset for shipping. Conversion increased 31%.
The pattern across successful implementations is that trust signals appear exactly where doubt would otherwise prevent purchase. If shipping time is a concern, display estimated delivery dates prominently. If ingredient safety matters, show testing certificates. If sizing is uncertain, provide detailed measurements and fit guides.
Money-back guarantees deserve particular attention because they address the single biggest objection: what if this doesn’t work? A 60-day guarantee mentioned in the FAQ section has minimal impact. The same guarantee highlighted in a colored box next to the add-to-cart button dramatically reduces purchase hesitation.
We tested this with a wellness brand that offered 60-day returns but buried the policy in their footer. Adding a guarantee badge directly on product pages with the text “Try risk-free for 60 days—full refund if you’re not satisfied” increased conversion by 18%.
Social Proof That Actually Convinces

Most Shopify stores display review stars and call it social proof. This baseline helps, but it’s not sufficient to meaningfully move conversion rates.
The gap between adequate social proof and conversion-driving social proof comes down to specificity and strategic placement.
Star ratings aggregate feedback into a single metric. They tell you other people bought this product and generally liked it. But they don’t answer the specific questions someone has before buying. Will this work for my particular problem? How long until I see results? What does it actually feel like to use this?
Text reviews with specific details provide far more decision-making value. A review that says “Great product, highly recommend!” adds minimal information. A review that says “I’ve struggled with falling asleep for years. Started taking this magnesium before bed and noticed within 3 days I was falling asleep in under 20 minutes. No grogginess in the morning. On my third bottle now” gives someone concrete information to evaluate whether this product might work for their situation.
Photo reviews amplify this further because they provide proof of purchase and demonstrate what the product actually looks like when it arrives. According to research from PowerReviews, products with photo reviews see conversion rates 112% higher than products without them.
The placement of reviews matters as much as the content. Standard practice puts reviews at the bottom of the page, after product description, ingredients, shipping information, and FAQs. By the time someone scrolls that far, they’ve either already decided to buy or bounced.
High-converting product page design surfaces the most relevant reviews earlier. A supplement brand we worked with added a “Customer Results” section immediately below their product description, featuring three text reviews with photos that included specific health outcomes. Product page conversion increased from 2.3% to 3.7%.
For products where visual results matter—skincare, fitness, before/after transformations—dedicating a full section to customer photos creates powerful social proof. We implemented a “Real Results” gallery on a beauty brand’s product pages showing 20+ customer before/after photos. The addition increased conversion by 34%.
User-generated content from social media serves a similar function. Embedding Instagram posts of customers using your product adds authenticity that polished brand photography can’t match. This works particularly well for lifestyle products where context of use matters—showing someone actually wearing that jacket, using that yoga mat, or cooking with that blender.
Pricing Structure That Maximizes Value Perception

Single-product, single-price pages leave money on the table and create unnecessary decision anxiety. The stores that maximize average order value and conversion rate offer tiered options that guide visitors toward optimal choices.
The psychology behind this is well-established. Presenting a single option forces a binary decision: buy this or don’t buy anything. Presenting multiple options shifts the decision to which option to buy, and the contrast between options influences perception of value.
A supplement brand selling individual bottles at $39 converted at 1.9% with an average order value of $43. We restructured their pricing to offer three options: single bottle at $39, three-bottle bundle at $99 (saves $18), six-bottle bundle at $168 (saves $66 plus free shipping).
Conversion rate increased to 2.8% because the bundles reduced perceived risk—if the first bottle doesn’t work, you have more time to evaluate. Average order value jumped to $87 because 64% of customers chose the three-bottle bundle, the middle option positioned as “most popular.”
The six-bottle bundle served a strategic purpose even though only 12% of customers chose it. Its presence made the three-bottle bundle seem more reasonable by comparison. Without the six-bottle option, the three-bottle bundle felt expensive. With it present, the three-bottle bundle became the rational middle choice.
Subscription options amplify this further by offering a meaningful discount in exchange for recurring purchase commitment. A 20% subscription discount serves multiple purposes: it reduces initial purchase hesitation through lower price, locks in customer lifetime value, and creates predictable recurring revenue.
We implemented subscribe-and-save on a skincare brand’s product pages with a toggle between one-time purchase and subscription, clearly showing the price difference and savings. Within 90 days, 38% of new customers chose subscription. Customer lifetime value increased from $67 to $186.
The key is making the value proposition transparent. Don’t hide subscription terms in fine print. Clearly state the discount, billing frequency, and cancellation policy. “Subscribe and save 20%—cancel anytime” removes the perceived risk of commitment.
Mobile-Optimized Design That Actually Works
Stating that mobile optimization matters has become cliché, but the execution remains poor on most Shopify stores. Claiming your site is “mobile-friendly” because it’s responsive misses the point entirely.
True mobile optimization means redesigning the entire product page experience for how people actually shop on phones, not just making the desktop version fit on a smaller screen.
The fundamental difference is information hierarchy and interaction patterns. Desktop users can see product images, descriptions, reviews, and add-to-cart simultaneously. Mobile users see one thing at a time, in sequence. That sequence needs to be deliberately structured.
Standard practice puts product images first, requiring mobile users to scroll past 4-6 images before seeing the product name, price, or add-to-cart button. This creates enormous friction. We restructured mobile layouts to show one hero image, immediately followed by product name, key benefit, price, and add-to-cart button. Additional images moved to a swipeable gallery below.
This change alone increased mobile conversion by 26% for an eco-friendly products brand. Mobile users could make a purchase decision without excessive scrolling, and those who wanted more details could continue down the page.
Sticky add-to-cart buttons solve another critical mobile friction point. On desktop, the purchase button remains visible in the sidebar while users scroll through product information. On mobile, it disappears as soon as you scroll down. Adding a sticky add-to-cart button that remains accessible while browsing product details increased mobile conversion by 19% for a supplement brand.
Touch-friendly interface design matters more than most store owners realize. Buttons smaller than 44×44 pixels are difficult to tap accurately on mobile. Dropdown menus and hover states don’t work on touch interfaces. Form fields requiring precise text entry create frustration.
We audited mobile usability for a beauty brand and found their product variant selector—size and scent options—used a dropdown menu difficult to operate on phones. Replacing it with large, tappable buttons increased mobile conversion by 14%.
Load speed on mobile networks dramatically affects conversion. According to Google’s research, 53% of mobile visitors abandon sites taking longer than three seconds to load. Every additional second of delay reduces conversion by approximately 12%.
The culprits are usually images and scripts. Implementing lazy loading for images below the fold reduced mobile load time from 5.2 seconds to 2.4 seconds for a wellness brand. Mobile conversion increased by 37%.
Common Design Mistakes That Kill Product Page Conversion
Understanding what works provides half the picture. Understanding what consistently fails helps you avoid wasting time on changes that don’t move the needle.
Overdesigning at the Expense of Clarity
The temptation to make product pages visually impressive often works against conversion. Elaborate animations, unconventional layouts, and artistic typography might win design awards but they rarely increase sales.
A skincare brand came to us with product pages featuring parallax scrolling, animated transitions, and a non-standard layout where product information appeared in unexpected locations. The pages looked visually distinctive. Conversion rate was 1.1%.
The problem wasn’t that the design was bad. It was that the design prioritized aesthetic differentiation over functional clarity. Visitors spent mental energy figuring out where to find information instead of evaluating whether to buy the product.
We rebuilt the pages with conventional structure—hero image and key information above the fold, logical flow of details below—while maintaining their brand aesthetic through color palette and typography. Conversion jumped to 3.2%.
The principle: clarity beats creativity in product page design. Save the experimental layouts for your about page or blog. Product pages need to be instantly comprehensible.
Hiding Critical Information
Certain information directly affects purchase decisions and needs to be immediately visible. Hiding it in tabs, accordions, or requiring clicks to reveal creates unnecessary friction.
Common examples include shipping costs, delivery timeframes, return policies, and ingredient lists for health products. When this information appears after someone adds a product to cart, it often triggers abandonment.
We worked with a supplement brand that showed pricing on product pages but required visiting the cart to see shipping costs. Cart abandonment rate was 73%. Adding a shipping cost calculator directly on product pages reduced abandonment to 64%. A nine-percentage-point improvement in cart completion translated to approximately $14,000 in additional monthly revenue.
Size charts for apparel, ingredient details for supplements, and technical specifications for electronics need to be easily accessible on product pages. This doesn’t mean cluttering the page with every detail. It means using expandable sections that are clearly visible and don’t require hunting.
Generic Product Descriptions That Say Nothing
The most common product description pattern goes something like this: “Our premium [product] is made with high-quality ingredients and designed to deliver exceptional results. Perfect for anyone looking to [vague benefit].”
This copy contains zero useful information. Every brand claims premium quality and exceptional results. The description could apply to literally any product in the category.
Specific, concrete details drive conversion. Instead of “high-quality ingredients,” specify “organic ginger grown in Peru, third-party tested for heavy metals.” Instead of “exceptional results,” cite “reduced bloating by 43% in clinical trials with 198 participants.”
We rewrote product descriptions for a wellness brand, replacing generic marketing language with specific outcomes, evidence from studies, and detailed ingredient sourcing. Average time on product pages increased by 34 seconds, and conversion rate increased from 1.7% to 2.9%.
Inconsistent Product Pages Across Catalog
Many Shopify stores use a template for some products but customize others inconsistently. The result is a disjointed experience where different product pages have different layouts, different levels of detail, and different quality standards.
This creates credibility problems. If your flagship product has extensive details, professional photography, and numerous reviews, but other products in your catalog have minimal descriptions and stock photos, visitors question whether those other products are actually worth buying.
Consistency doesn’t mean every product needs identical layouts. It means every product page maintains the same quality standard, includes the same types of information, and follows the same structural hierarchy. If your magnesium supplement page includes clinical study results, your vitamin D page should include them as well.
We audited a beauty brand’s product catalog and found their top three products had detailed, conversion-optimized pages while the remaining seventeen products had minimal information. Systematically upgrading all product pages to match the quality of their best performers increased overall catalog conversion by 28%.
How Professional Product Page Design Drives Revenue
The financial impact of conversion-optimized product page design compounds across your entire business model.
Consider the math on a store generating 15,000 monthly product page visitors. At 1.8% conversion with $52 average order value, monthly revenue is $14,040. Improving product page conversion to 3.5% through strategic redesign, with the same traffic and average order value, generates $27,300 monthly—a $13,260 increase.
Annually, that’s $159,120 in additional revenue from the same traffic you’re already paying to acquire. The investment in professional product page design—typically $8,000-$15,000 for a complete catalog optimization—pays for itself in roughly one month.
The leverage extends beyond direct conversion impact. Product pages optimized for clarity and information density tend to generate more return visitors and higher brand recall. According to research from Salesforce, 80% of customers say the experience a company provides is as important as its products.
Better product page design also improves organic search performance. Google’s algorithm increasingly prioritizes pages that satisfy user intent and provide comprehensive information. Product pages that thoroughly answer customer questions and include relevant keywords naturally rank higher for product-specific searches.
A supplement brand we worked with saw organic traffic to product pages increase by 47% within six months of implementing conversion-optimized designs. The pages ranked better because they contained more useful information presented in a clearer structure, increasing time on page and reducing bounce rate—both signals Google uses to evaluate page quality.
The Strategic Framework for Redesigning Product Pages
Successful product page redesign follows a systematic process that addresses each conversion barrier in priority order.
The diagnostic phase involves analyzing existing product page performance to identify specific failure points. We examine heat maps showing where visitors click, scroll maps indicating how far down the page people read, and session recordings revealing where confusion or frustration occurs.
For a beauty brand we worked with, heat maps showed 68% of visitors clicked on product images expecting a zoom function that didn’t exist. Implementing zoomable images increased conversion by 11%. Session recordings revealed that mobile visitors struggled to select product variants using dropdown menus. Replacing dropdowns with large tap targets increased mobile conversion by 19%.
These insights are specific to your store and your audience. Generic best practices provide a starting point, but actual performance data reveals which elements matter most for your particular situation.
The strategic phase involves prioritizing changes based on potential impact and implementation complexity. Some improvements—rewriting headlines, adding trust badges, restructuring information hierarchy—can be implemented quickly. Others—professional product photography, video production, custom functionality—require more time and investment.
We typically recommend a phased approach. Quick wins get implemented first to generate immediate conversion improvement and revenue impact. That additional revenue funds larger initiatives like professional photography or video production. Within 90 days, most brands have completed a full product page optimization with measurably improved conversion rates.
The testing phase involves A/B testing variations of key elements to validate improvements before committing to changes across your entire catalog. We might test two different headline approaches on your best-selling product, measuring which drives higher conversion over a two-week period. The winning variation gets applied to other products in the catalog.
This data-driven approach removes guesswork from design decisions. Rather than debating whether customers prefer this layout or that color scheme, you test it with actual visitors and let conversion data determine the answer.
When to Bring in Product Page Design Expertise
Most Shopify store owners recognize their product pages could be better. Far fewer understand how to systematically improve them or have the time to execute properly.
The DIY approach to product page optimization typically follows this pattern: read articles about best practices, make changes based on general recommendations, hope conversion improves. Sometimes it works. Often it doesn’t, because the changes address generic concerns rather than your specific conversion barriers.
Professional product page design starts with diagnostic clarity—identifying the exact elements preventing conversion for your specific store, audience, and product category. We analyze heat maps, session recordings, user feedback, and comparative benchmarks to determine where visitors drop off and why.
The execution requires expertise across multiple disciplines. Copywriting that sells outcomes rather than features. Visual design that creates clear hierarchy and guides attention. Technical implementation that works across devices and browsers. Photography direction that builds confidence rather than just looking pretty. Conversion psychology that understands how people make purchasing decisions.
Attempting to self-implement all of this while running your business creates opportunity cost. The forty hours you spend learning conversion optimization, testing layouts, and troubleshooting technical issues is forty hours not spent on product development, customer service, marketing, or operations.
The brands that see fastest ROI from professional product page design share certain characteristics. They’re already spending meaningfully on traffic acquisition—$5,000+ monthly on ads. They have product-market fit and decent brand recognition. Their current product page conversion sits below 2.5%. They’re generating traffic but failing to monetize it effectively.
If you’re not yet spending on ads, optimizing product pages might be premature. You need sufficient traffic volume to see meaningful revenue impact from conversion improvements. If your conversion rate already exceeds 4%, you’re likely past the point of major structural fixes and into incremental testing territory.
But for stores in that middle zone—spending money on traffic while converting poorly—the economics of professional product page optimization are compelling. You’re already burning cash on visitors who don’t convert. Fixing the conversion problem turns that traffic spend from a loss into a profit center.
Our Approach to Product Page Design That Converts
The product pages detailed in this article represent specific projects where we documented measurable conversion improvements. These aren’t projections or theoretical frameworks. They’re proven results from systematic optimization applied to real stores in health, wellness, beauty, and sustainable product categories.
Our product page design methodology focuses exclusively on conversion impact, not aesthetic preferences or trendy design patterns. We rebuild pages around the specific psychological drivers and trust signals that influence purchase decisions in your product category. We optimize for the actual devices and contexts your visitors use. We structure information hierarchies that answer questions in the sequence people naturally ask them.
If you’re running a DTC brand in health, wellness, beauty, or sustainable products, currently spending $5,000+ monthly on traffic, and converting below 2.5%, there’s likely $100,000-$300,000 in annual revenue sitting untapped in your existing product page visitors.
We offer comprehensive product page audits that analyze your specific store and identify your highest-impact optimization opportunities. You receive a detailed Loom video walking through your product pages with specific recommendations, before/after mockups of suggested changes, and estimated revenue impact based on conversion benchmarks from similar stores we’ve optimized.
This isn’t a sales presentation. You get actionable intelligence whether you implement changes internally or decide to work with specialized design expertise. Most brands we work with see clear ROI within 60 days, but the audit itself provides a roadmap regardless of implementation approach.
Request your product page design audit here: storecraftstudio.in/product-page-audit
The difference between product pages converting at 1.5% and product pages converting at 4% isn’t luck or budget size. It’s systematic optimization of the specific design elements that drive purchase decisions. The stores that win are the ones that stop treating product page design as an aesthetic exercise and start treating it as a conversion science.